|
|
Deja Vu: Car Sales Worst in 21 Years “Domestic auto industry new-car sales
in 1982 were the worst in 21 years.” Automotive News 1983 Market Data Book. New-vehicle sales for
2009 are expected to be the lowest in 27 years (since 1982). Back then there were 4 domestic auto makers; American Motors, Chrysler, Ford and GM.
Here we are 27 years later with half as many domestic auto makers, but the same headlines. As we
look back over new-vehicle sales there are peaks and valleys in the total units sold each year. The deepest
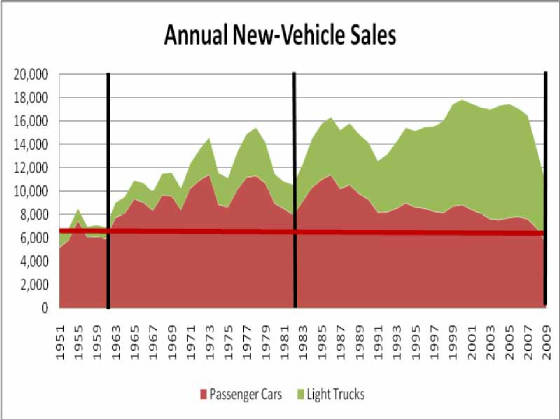
valleys seem to come every 20 to 25 years. In the chart below the red area represents the number of passenger
cars sold each year and the green area shows the number of light trucks sold. Overall, both follow the same basic pattern. The
last few years light truck sales far outpaced passenger car sales, then when light truck sales tanked the overall drop was
more precipitous than we have seen in the past. In 1961, new-vehicle sales dropped to 6.9 million units,
after setting a new record in 1955 of 8.5 million. Then in 1982 sales fell to 10.5 million after rising
to an all time high of 15.2 million in 1978. Now we are expecting 2009 to come in around 10.4 million units
after setting a new sales record in 2000 of 17.8 million.
We have to ask: is there something about
the auto industry that causes these significant drops in sales? Can we expect there to be another such
decrease in business 20 years from now? Or is it something inherent in the US economy that causes these
downturns and the auto industry is just a victim? We have 3 major downturns in the last 50 years to look
at in order to find the answer. The Early 1960s recession was characterized by astronomically high unemployment rates, incredibly high inflation
and a bad Gross National Product rating. These all worked together to cause consumer confidence in the
system to plummet, and caused a downward spiral to develop that destroyed a number of businesses. This in turn caused unemployment
to rise, and so the cycle began again. The 1980s recession can be mostly attributed to the Iranian Revolution which took place in 1979. This revolution
caused a sharp increase in the price of oil all around the world. The new regime exported oil at what were
not only inconsistent levels, but at a much lower volume. This forced the price of oil up. The United States enacted a tight
monetary policy to control inflation, and this led to another recession. The late 2000s recession was essentially started by
the collapse of the housing market. Then, bank collapses caused a sort of public panic. Also, the amount
of available credit spiraled downward, making it almost impossible for anybody to get a loan. As consumer
confidence continues to plunge, things continue to get worse. Many have called this recession the worst since World War 2. At the core of all three recessions was something
that negatively impacted consumer confidence and therefore spending. It makes sense considering that consumer
spending accounts for about 60% of the country’s GDP. In a future newsletter we will report on the
comparison of consumer confidence changes and their relationship to sales in the industry. |
|
Enter supporting content here |