|
|
Where Was That Made? The
subject of where products are manufactured has usually been a secondary concern for enthusiasts and manufacturers, but during
the economic downturn many people on both sides of the isle have become much more cognizant of the situation.
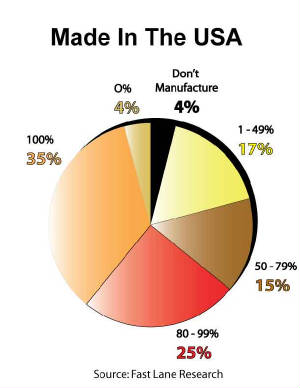
Furthermore, from our research, enthusiasts are becoming irritated with substandard product quality. The topic of manufacturing location has begun moving from the backburner to the forefront. When asked about the location of product manufacturing, 35% of companies indicated that all of their products are produced in the US, 25% produced the majority of their products here (80-99%), 15% made more than half to three-quarters (50-79%), 17% made less than half (1-49%) and just 4% rely entirely on manufacturing in other countries. For three-out-of-four
companies in the industry at least 50% of their products are manufactured in the US.
From “where are your products made,” we shift to “where are your products sold.” Even as the automotive hobby extends throughout the world, sales of products to US-based consumers are significant to industry businesses. Nearly all (98%) of companies rely on more than half of their sales to come from domestic clients, with 12% staying within the country completely. The next largest market is Canada where almost quarter (22%) of company’s place 11-25% of their sales there. These numbers aren’t really very surprising considering that for the most part the US automotive performance parts and accessories industry targets Detroit iron. For these companies, exports are largely driven by the existence of US made vehicles in other countries in sufficient numbers to make the process worthwhile. One of the issues the industry has yet to resolve is identifying vehicles sold in other countries that are nearly the same as US products but badged with a different name. For instance, a Ford vehicle is sold under the name Falcon in Australia that looks very much like the Mustang sold in the US. Having reliable data about such vehicles and the extent to which they are different from their US produced counterparts, could help industry manufacturers realize where the exporting opportunities really are. International Sales
The whole issue of exports is far
larger than just the automotive performance parts and accessories industry. The most current government
data on exports and imports details just how far out of balance the two are. Recently the U.S. Bureau of
Economic Analysis announced that December exports totaled $142.7 billion and imports were $182.9 billion. That
resulted in a goods and services deficit of $40.2 billion, up from $36.4 billion in November. In December, the exports of goods increased
$4.6 billion to $99.1 billion, and imports of goods increased $8.1 billion to $150.9 billion, increasing the goods trade deficit
$3.4 billion from November to $51.8 billion. The November to December increase in exports of goods reflected increases in capital goods ($1.8 billion);
industrial supplies and materials ($1.6 billion); automotive vehicles, parts, and engines ($0.9 billion); other goods ($0.3
billion); and consumer goods ($0.3 billion). The continuing imbalance in trade leads to more jobs being lost in the US. Source: Fast Lane Research |
||||||||||||||||||||||||||||||||||||||||||||||||||||||||||||||||||||||||||||||